
Why is your website slow? Find server and front-end delays with AI
You open a website and wait. The page stays blank, the main image arrives late, or a loading spinner keeps turning. Something is slow, but that tells you very little about where the problem starts.
A delay can happen while a server prepares a response, while information travels across the network, or while the browser turns downloaded files into a usable page. Several delays can happen during the same visit.
This guide explains how to tell those stages apart and use artificial intelligence (AI) to help investigate. You do not need to know every performance term before you begin. You need a clear symptom, a few measurements and a way to check each suggestion.
What happens when a page loads?
A server is a computer or service that responds to requests. The front end is the part of the website your browser displays and runs. Loading involves both, with a network connecting them.
- Request: your browser finds the destination, establishes a connection and asks for a page.
- Response: the server returns HTML, the document that describes the page. It may need to run application code, retrieve data or call another service first.
- Download and display: the browser discovers resources such as images, CSS style rules and JavaScript, then processes them and draws the page.
These stages overlap. A browser can start working before the whole document arrives, and JavaScript may request more data later. A page can appear quickly while a particular feature continues waiting.
Three places to look for a delay
The response takes time
Purpose: Find out what happens before useful content starts arriving.
Possible server-side causes include an expensive database query, a busy application or a slow external service. A database query is a request to retrieve or change stored information. A cache, which reuses a previously prepared response, can affect how much work is needed.
Time to First Byte (TTFB) measures how long it takes to receive the first byte of a response. For a page navigation, it can include redirects, connection setup and network travel as well as server processing. A high TTFB is a clue to investigate, rather than proof that hosting is the cause. See web.dev’s explanation of TTFB.
To narrow this down, compare the browser timing with server logs or monitoring for the same request and time. If you cannot access those records, ask your developer or host for that evidence.
The files arrive late
Purpose: Separate a late request from a slow transfer.
An image can be late because it is large, the connection is slow, or the browser only discovers it after running a script. These need different fixes. Look at when the request starts as well as how long it lasts.
Lazy loading postpones non-essential resources until they are needed. That can help with images further down the page. Applying it to the main image visible immediately can delay content readers came to see. MDN explains how lazy loading works.
The browser has more work to do
Purpose: Check the gap between receiving a resource and showing it.
Downloaded does not always mean visible. CSS can block rendering, which means drawing content on screen. JavaScript can occupy the browser’s main thread, where much of the work needed for scripts and rendering happens. Content may also remain hidden until a script reveals it.
Largest Contentful Paint (LCP) measures when the largest eligible image or text block in the visible area appears. It does not mean every feature is ready. Its breakdown separates TTFB, resource load delay, resource load duration and element render delay. This helps distinguish late delivery from late display. See web.dev’s guide to investigating LCP.
Find the evidence in Chrome DevTools
Start with one page and one symptom, such as “the main image appears late on my phone”. Record the device, browser, login state and whether this is a first or repeat visit.
Open DevTools: right-click the page and choose Inspect. Alternatively, press Command + Option + I on a Mac, or Ctrl + Shift + I on Windows or Linux. These Chrome DevTools shortcuts open the tools beside or below the page.
DevTools contains several panels. Use Network for requests, Elements for HTML attributes and Performance for browser activity. The Console is another panel, mainly for JavaScript messages and commands. If a tab is hidden, look in the double-chevron overflow menu.
The screenshots below come from Google’s DevTools documentation. They show where to look, rather than results from Coded Female. Chrome versions and docking positions can change the layout. On a phone, open each screenshot at full size to read the labels.
1. Find TTFB in Network
- Select Network before reloading the page. Check that recording is active. If the list is empty, reload again while this panel is open.
- Choose the Doc filter to show document requests. Select the main page under Name. For a slow data response instead, use Fetch/XHR and select that request.
- Open the request’s Timing tab. Find Waiting for server response, sometimes labelled Waiting (TTFB).
- Record that duration separately from Content Download. The Time column gives the request’s overall duration, rather than just its waiting phase.
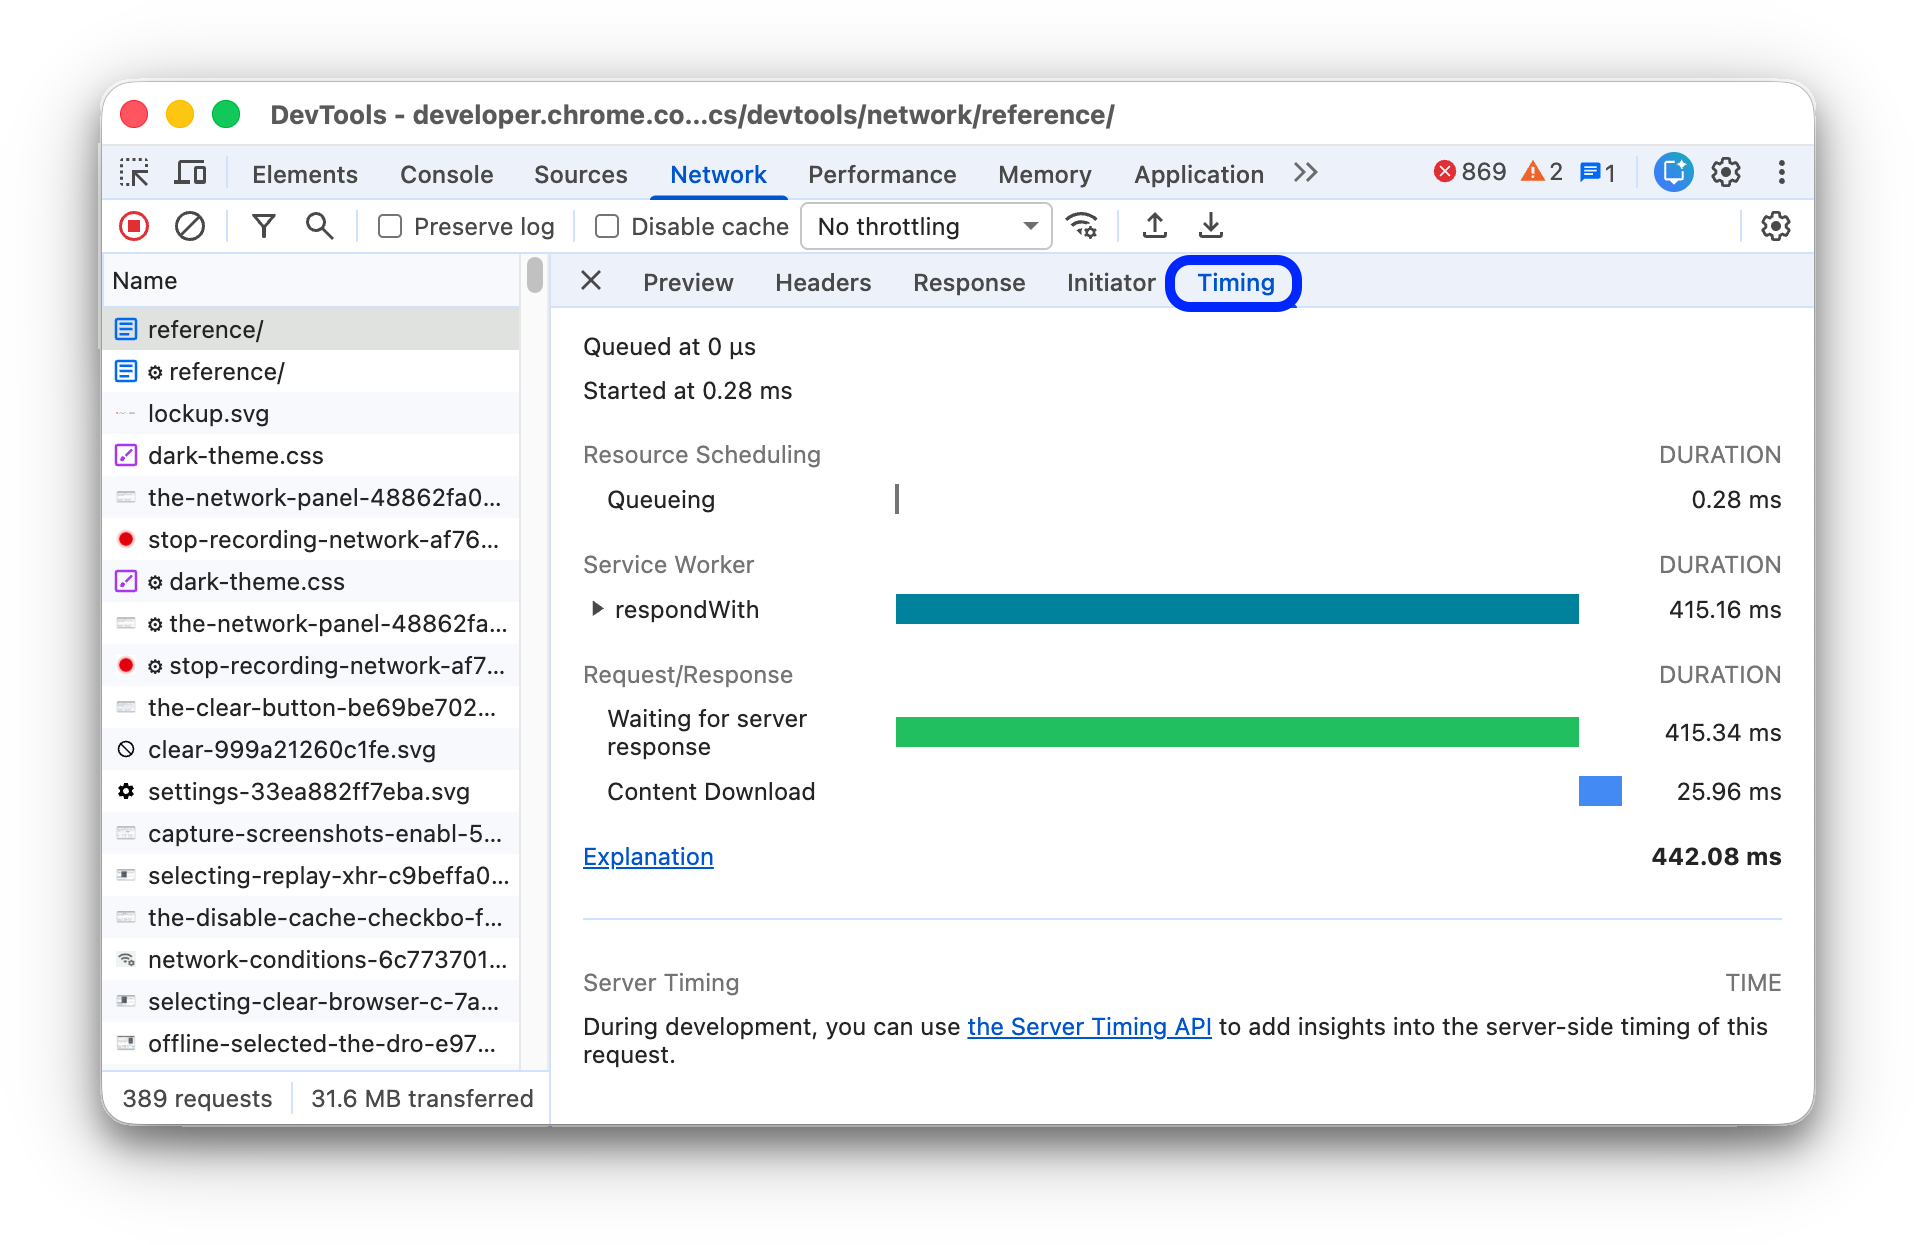
Read it carefully: this request-level waiting phase includes network travel and response preparation. Navigation TTFB can also include earlier redirects and connection setup. The screenshot includes Service Worker activity, which can intercept requests; your breakdown may have different rows. Use server-side evidence before concluding that hosting is the cause.
2. Check when an image is requested
- In Network, choose Img. Reload from the top of the page and find the affected image. Use the Filter box if you know part of its filename.
- Look across to Waterfall. Compare when the image starts with the document and other early resources. The screenshot is a general waterfall view; it has not yet been filtered to images.
- Select the image and open Timing to separate waiting from downloading. Use Initiator to investigate what triggered the request.
- To investigate an image further down the page, scroll towards it and watch for a new request. Keep cache and throttling settings consistent when repeating the test.
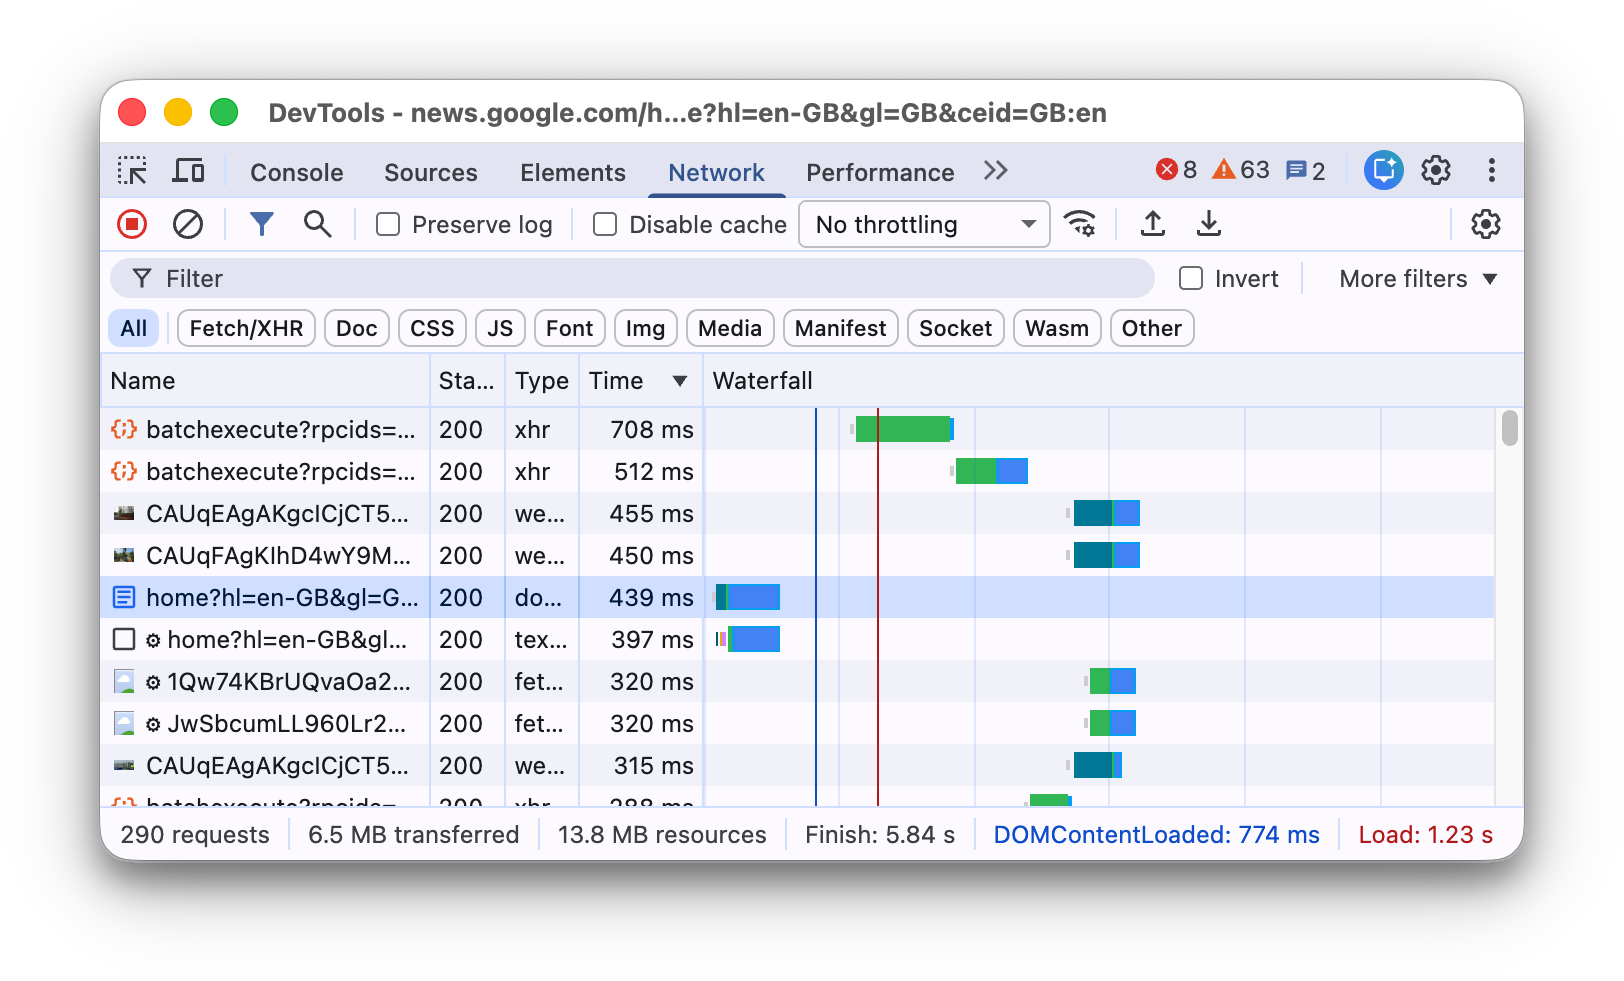
What this tells you: a late request start differs from a long transfer. A request appearing near a scroll can support a lazy-loading explanation, but the browser may start fetching before the image becomes visible. Cache hits and custom scripts can also affect what you see.
3. Find an image’s lazy-loading setting
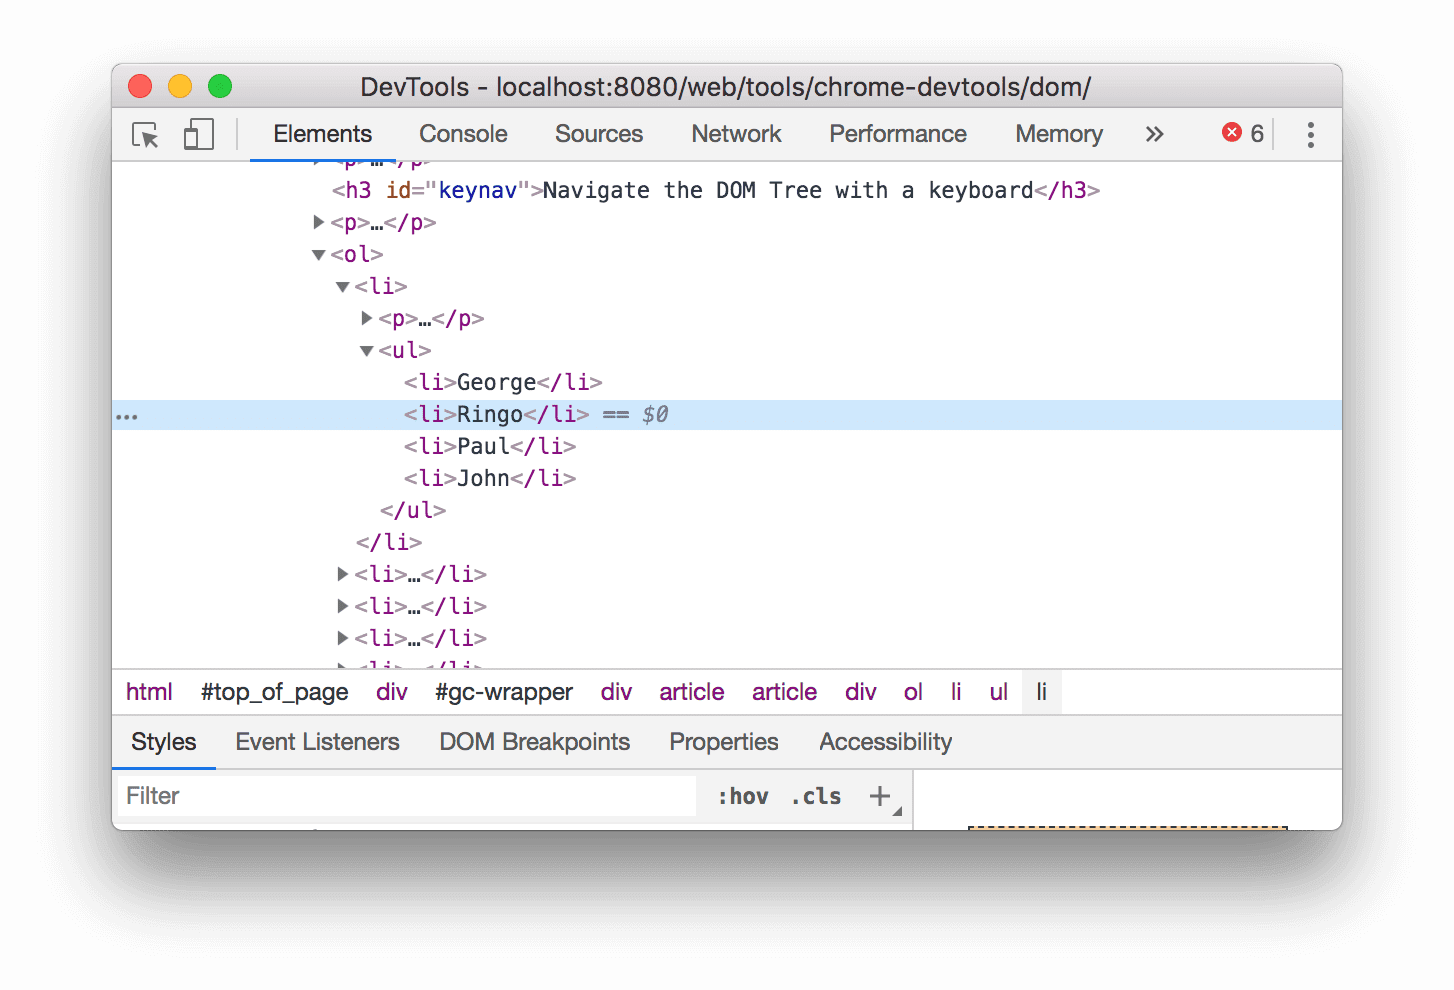
- Right-click the image on the page and choose Inspect. Chrome opens Elements and highlights an item in the page’s structure, called the Document Object Model (DOM).
- Find the actual
<img>element. If Chrome selected a surrounding link or container, expand it using the small triangle until you reach the image. - Look inside that tag for
loading="lazy". This asks the browser to defer the image until it approaches the visible area.loading="eager"requests normal loading without that deferral. - Check the image’s position and the Network evidence together. If no loading attribute is present, JavaScript may still delay loading or insert the image later. Absence of the attribute does not rule that out.
For example, this is the attribute you are looking for on an image:
<img src="course-image.webp"
     loading="lazy"
     width="800" height="450"
     alt="Course materials">
The code example is separate from Google’s Elements screenshot, which demonstrates node selection. MDN documents the image loading attribute. For a main image visible immediately, investigate whether lazy loading delays it. Do not remove lazy loading from every image as a blanket fix.
4. Find browser work in Performance
- Open Performance and use Record and reload, the circular-arrow recording control. Let the load recording finish.
- Find the LCP marker in the recording. It marks the largest eligible visible content appearing, rather than every feature becoming ready.
- Expand the Main track if it is collapsed. Inspect tasks before LCP and click an event to view its duration and details.
- Compare this activity with the image’s request timing. If its file has arrived but the content is still not visible, investigate the remaining script and rendering work.
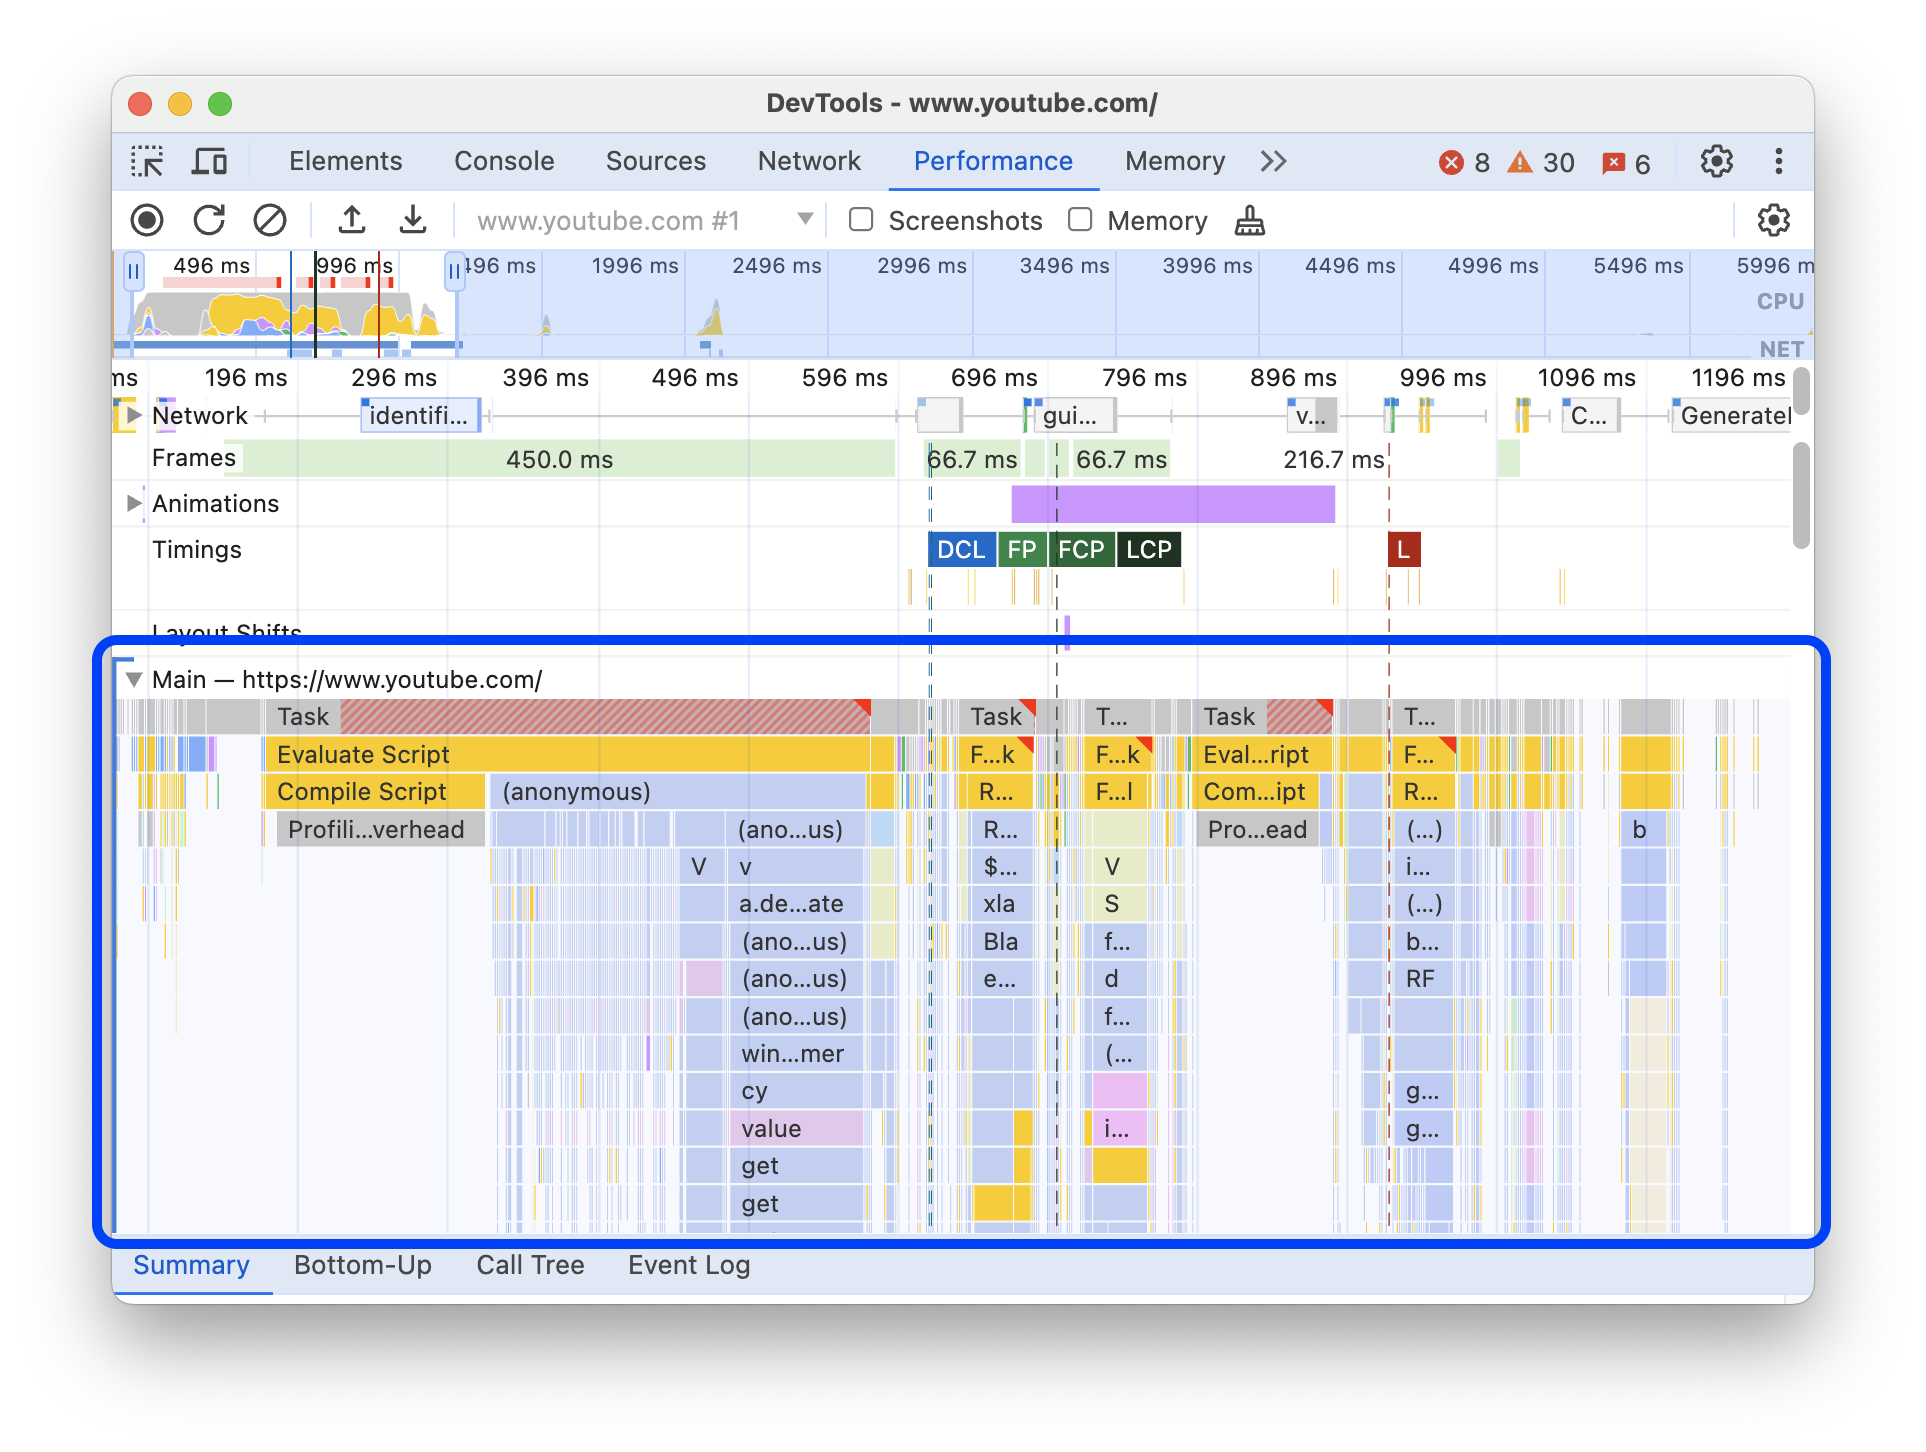
The coloured blocks show different kinds of browser activity. A long task near LCP is a lead to test; timing overlap alone does not establish that it caused the delay. Chrome’s Performance reference explains the recording controls and Main track.
Before giving AI the results: collect several runs under matching conditions and keep the individual values. Note whether browser caching was disabled; this does not clear server caches. Share a sanitised summary, including what you inspected and which stage appeared slow.
Use AI to turn clues into tests
AI can explain unfamiliar labels, organise observations and review a small piece of relevant code. It cannot see your server logs, browser recording or code unless you provide them or explicitly connect a tool with access. A confident answer still needs evidence.
Use an approved AI tool for work material. Prefer a short, sanitised summary over a raw export. Network archives, logs and screenshots can contain cookies, tokens, personal data, private addresses or response content. Inspect what you share and remove sensitive details.
1. Ask for an investigation plan
Purpose: Get a useful next check from the evidence you have.
Help me investigate a slow page. Symptom: the main image appears late. Across three runs with the same test settings, the HTML starts arriving at about 0.4 seconds. The image request starts at about 2.1 seconds and finishes at about 2.5 seconds. The image appears at about 3.4 seconds. These timings are relative to navigation start. Separate observations from hypotheses. Rank three possible explanations, explain what each timing does and does not tell us, and give one check that could support or rule out each explanation. Do not assume the server is the cause.
Those example timings direct attention towards the wait before the image request and the wait after it finishes. They do not establish which script, style rule or loading setting caused either gap.
2. Review the relevant code
Purpose: Understand a proposed change before trying it.
Review the sanitised HTML and JavaScript below against these observations. Identify any code that could delay discovering or displaying the main image. Explain the mechanism in plain English and distinguish evidence from assumptions. Suggest the smallest reversible change to test on a staging copy, list possible side effects and describe how to measure the result. If the evidence is insufficient, tell me what to collect next.
A staging copy is a separate version used to test changes. Include only the code connected to the issue. Ask AI to explain why a change should affect the measured delay, rather than accepting a broad rewrite.
3. Compare the result
Purpose: Check whether the change improved the experience.
Compare these before-and-after measurements from repeated runs under matching conditions. Describe the variation, which loading stage changed and what remains uncertain. Check whether the evidence supports the proposed explanation. Suggest one next test only if there is still a clear unresolved problem.
Check the actual page as well as its timings. An improvement should preserve the image, layout, navigation and any affected interactions. A better score alongside a broken feature is not a successful fix.
An example: a fast response and a late image
Consider a course page where the heading appears promptly but the main image arrives much later. The Network panel shows that the image request begins only after a slideshow script finishes loading.
AI suggests checking whether JavaScript inserts the image into the page. The developer inspects the code and confirms that it does. A test on staging makes the initial image discoverable in the HTML, while keeping the slideshow’s later behaviour.
The team then repeats the same measurements. If the image request starts earlier and the image appears earlier across comparable runs, that supports the explanation. If display remains late, they inspect the remaining rendering work. They have a specific hypothesis and a way to challenge it.
If instead a data request spends most of its time waiting for a response, the next investigation may need server-side evidence. Ask AI to help interpret a sanitised timing summary, then check the corresponding application work. Changing image sizes would not test that explanation.
Be careful with blanket performance fixes
On WordPress, one plugin can affect both server processing and browser resources. Its name alone does not identify the slow stage. Test a suspected plugin on staging and compare the same page before changing the live site.
Treat “defer every script”, “cache everything” and “lazy-load every image” as suggestions requiring context. Scripts can depend on each other, personalised pages need appropriate caching rules, and immediately visible images need timely loading. Ask what evidence supports the change and how you would undo it.
Your next step: explain one delay
Choose one slow page. Record what the reader is waiting for, inspect the relevant request and capture a performance recording. Give AI a sanitised summary and ask for a ranked hypothesis with a test that could prove it wrong.
You do not need to solve every performance issue at once. Aim to explain one delay, test one change and check whether the page becomes more useful to the person waiting. That gives your next decision something solid to stand on.
Technical sources linked throughout were checked on 26 October 2026. Scenarios and timings are teaching examples, not measurements of Coded Female or results from a client project.


You May Also Like

User Story Mapping: A Comprehensive Guide with Real-Life Examples

JavaScript recursion stuck? Trace the work left before changing the code